

In any type of business, tracking statistics and comparing data across different parts of the workflow is important for the company development. By studying the statistics, businesses can find reasons why they succeed or fail.
While processing a small number of pre-owned phones (less than 50 per month) it’s okay to use spreadsheets or paper notebooks to organize the workflow of your business.
But after the business expands and testers process more devices, it gets more and more difficult to handle all the numbers that way. There is no way to count all the numbers and data by yourself.
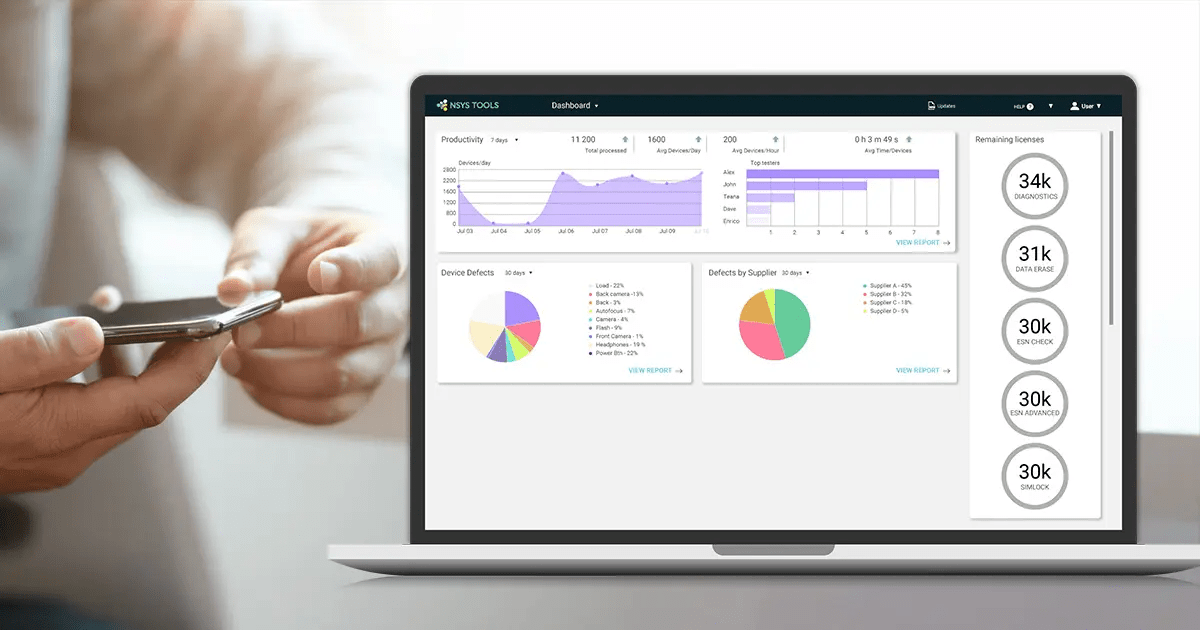
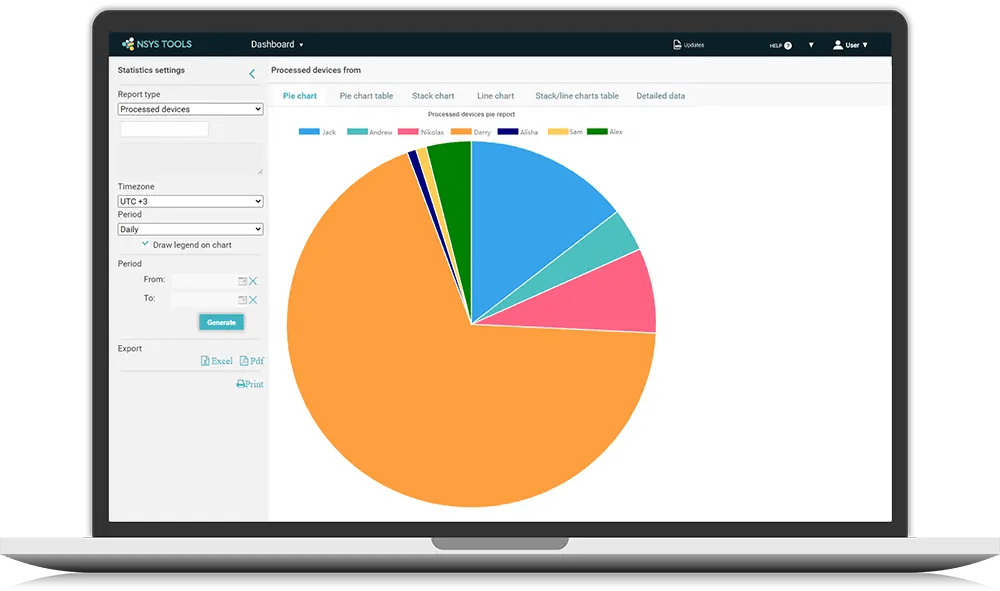
NSYS Tools provides an advanced analytics dashboard, which is already installed into your account. You can track statistics of phone models, suppliers, testers, defects, etc. By monitoring the statistics in real-time you can be sure of the accuracy of the data because all numbers refresh every second.
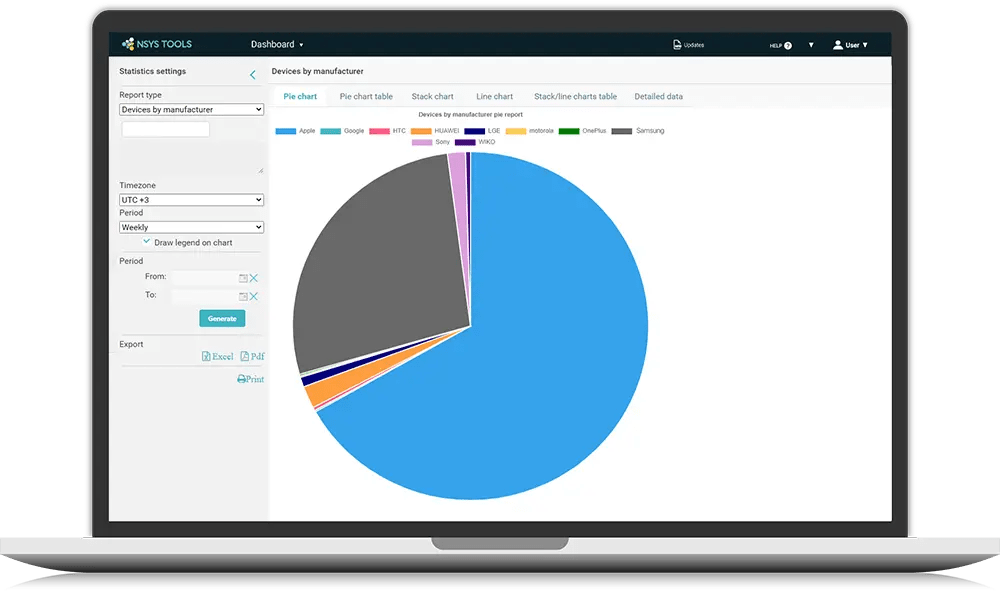
Track devices by manufacturer
For mobile phone traders, it’s important to track data of the most demanded phone models by weeks/months/quarters/years. By planning future sales, retailers can estimate average profits.
The software shows the statistics of iOS and Android devices for any period of time in a couple of clicks. All models are already added to the list and you can customize what data are displayed to you.
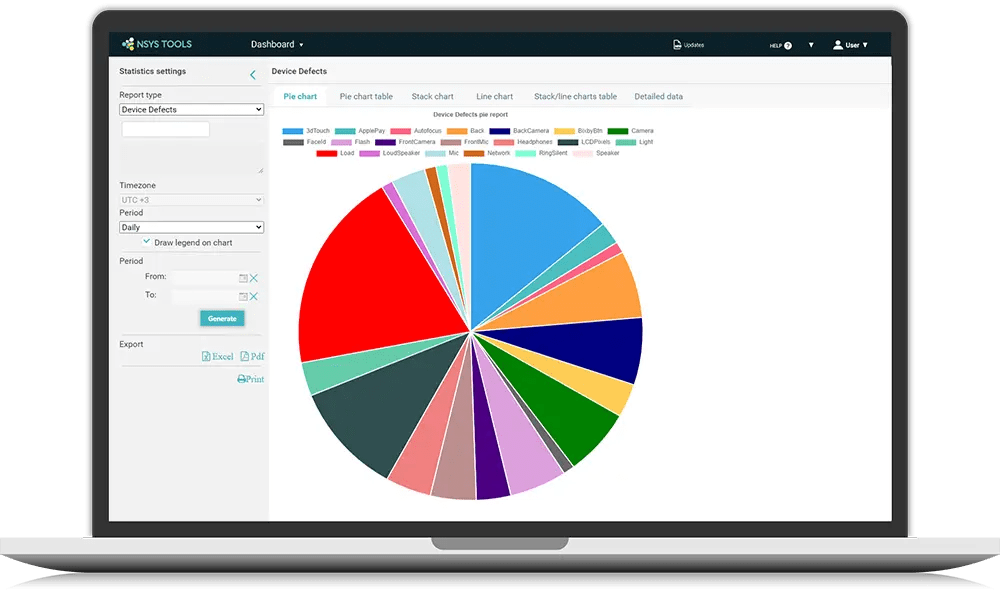
Track device defects
NSYS Tools software collects data about more than 100 defects, including replaced device parts, battery health, audio issues, fingerprint flaws, etc. All data are transferred right from the NSYS Test app right after the diagnostic process is over. Analysis of statistics gives a clear understanding of the most common defects that are worth paying attention to.
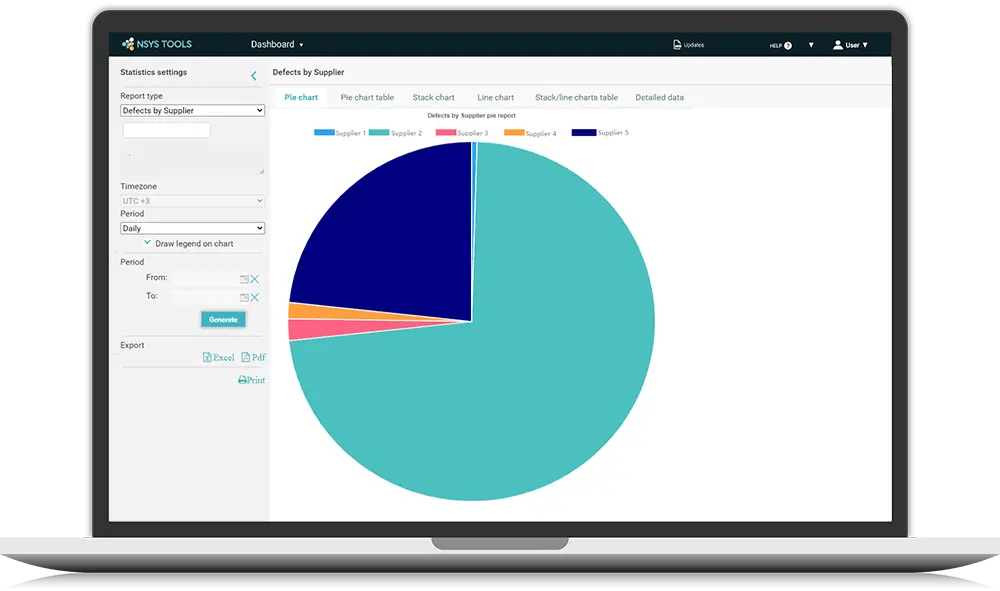
Track device defects by supplier
Put all the suppliers’ information into the list and monitor the ratio of processed devices to the defects in correlation with the suppliers. It will help to reduce the RMA rate and prevent profit losses. No paper or spreadsheets with the list of suppliers are required.
Track the QC dept. productivity and UPH
Get personal statistics of any tester in regards to the processed devices. Track the productivity of your QC department and see the average processing time per device.
Track UPH (units per hour) records. Our UPH tool calculates the average amount of devices processed per hour or day, and the average time per device. The higher your UPH, the greater value and productivity.
Cloud-based Dashboard
The results for every device the company processes are stored in your cloud account and can be accessed through the dashboard. The dashboard requires no additional resources for deployment, all you need is to log into the account and click the "Dashboard" button.
Our cloud-based Dashboard shows real-time statistics of the store or the whole company. Check the device information, QC productivity, UPH, suppliers analytics, and defects statistics. You can easily follow up on your business and plan the purchase of new devices from the most trusted suppliers.
Also read our blogpost about pre-owned mobile devices testing.