Analytics is an integral part of building an efficient workflow in any business. Deep study and comparison of data, as well as making related conclusions, allows you to determine current trends and see the overall picture of the market. Without analyzing statistics, it is impossible to build the right strategies for the company's development.
Despite the importance of detailed analytics, many companies neglect it because of long and complicated tracking. And it is almost impossible to find ready-made statistics for specific models, regions or defects.
If you work in the secondary mobile market and don't have enough technological and human resources to conduct your own analytics, we, as a global QC software provider, have compiled general statistics of our unique insights and other important data from trusted sources for you.

General Market Trends
First of all, it should be noted that the share of used devices in the official mobile market is rapidly growing because of improved methods of device grading, collection, repairing and online/offline selling.
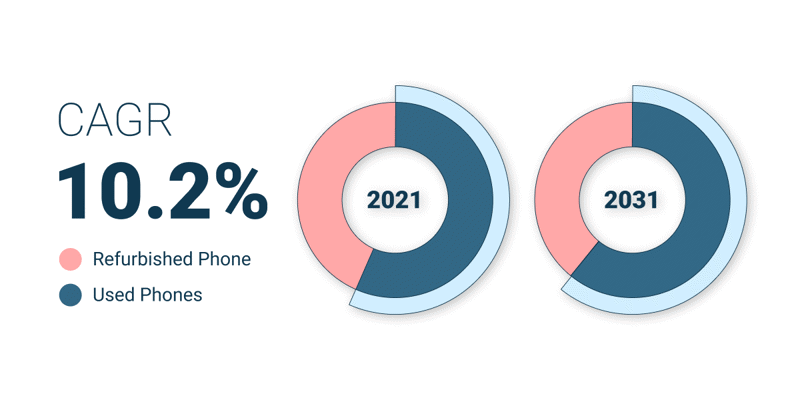
Pre-owned phone sales now contribute to 11% share of the global market. According to Persistence Market Research analysis, the global refurbished and used mobile phones market is expected to rise at a CAGR of 10.2% and be valued at US$ 143.8 Bn by 2031.
IDC projects used smartphone shipments will reach 351.6 million units in 2024.
By the way, considering the secondary market separately, the share of refurbished devices in official channels is increasing year to year. According to forecasts, this trend is to continue in the coming decade.

The most tested devices
It is important for mobile phone sellers to keep track of the most popular phone models. By tracking live statistics, retailers can evaluate the potential profit from different device models operations. Based on the statistics from NSYS Diagnostics, we can define the most tested and, therefore, popular devices among the secondary market.
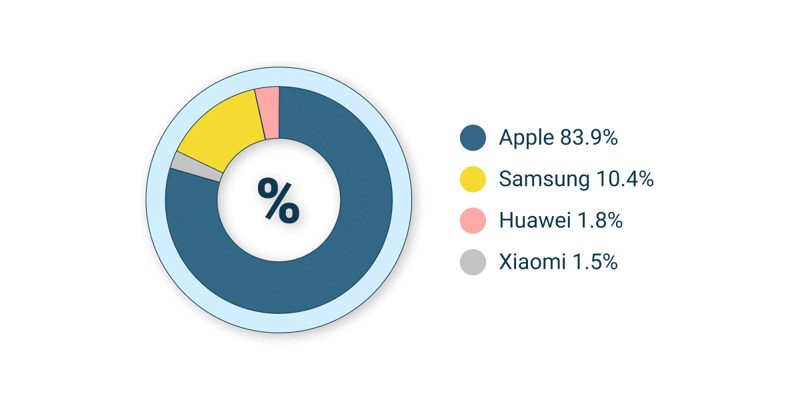
By a wide margin (83.9%), Apple devices are in the lead. The rest is made up of Samsung (10.4%), Huawei (1.8%), Xiaomi (1.5%) and others.

Top-5 popular used device tests
Our technical support department created a list of the most popular tests our customers perform when diagnosing their devices. These are tests of sensors, buttons, audio, touchscreen and LCD.

Top-10 defects
As well as test results we have a clear understanding of the most common defects that are worth paying attention to.

According to these data, the battery is the most frequently broken device component, expensive and vulnerable. Thus, the load battery test is one of the most important features when choosing a smartphone. It is not on the top list since many companies skip it due to the length and difficulty in conducting, while losing a lot of money on incorrect device evaluation.
Other trends
- The global spreading of 5G networks is driving more devices supporting 5G into the secondary market.
- Trade-in programs are still the fastest growth driver of the used smartphone market.
- Сooperation between secondary mobile market players and e-commerce platforms as well as the increasing popularity of special e-commerce platforms for used and refurbished phones fuel market demand.
- Device life cycle continues to increase expanding the share of pre-owned devices in the overall mobile market.
Be ahead of the time while keeping control over your working process with NSYS!


